Deployment of LGBM model with Continuous Training, Continuous Integration and Continuous Deployment.
I used a drinking dataset and employed the LGBM Classifier to predict the target variable distinguishing between drinkers and non-drinkers. The comprehensive notebook, available in my GitHub repository, contains detailed exploratory data analysis (EDA) and a step-by-step process that includes feature selection, data scaling, model selection, and hyperparameter tuning. Additionally, I developed an interactive web application using FastAPI and ensured ease of distribution and access by containerizing it with Docker.
Deployment of a Support Vector Classifier (SVC) model using FastAPI and Docker.
In this project, I deployed an SVC model using churn data, applying meticulous model selection and hyperparameter tuning through GridSearchCV. I constructed a user-friendly web application with FastAPI , allowing seamless interaction with the predictive model. To facilitate ease of use and distribution, I encapsulated the application within a Docker container. For convenient access, you can directly download the Docker image of the application from my GitHub repository.
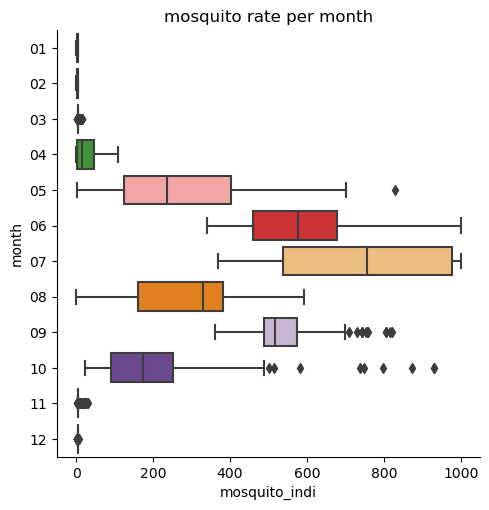
EDA and Extra Tree Regressor model with Mosquito Indicator Data.
I conducted an exploratory analysis of the mosquito rate dataset, and subsequently, I developed a predictive model to forecast the mosquito rate based on the selected variables. The project encompassed model selection with cross-validation and hyperparameter tuning . Additionally, I employed various metrics, including Mean Squared Error (MSE) , Root Mean Squared Error (RMSE) , R-squared (R2) , and residual plots, to evaluate the performance of the model.
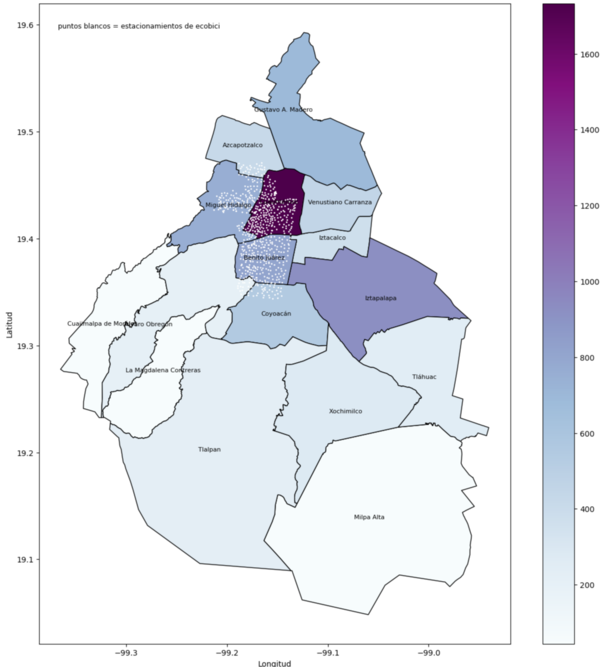
Analyzing bicycle accidents in Mexico city between 2018-2022.
With data from the open data portal of Mexico City I create a comprehensive map describing bicycle-related accidents distributed across Mexico city districts. The project encompassed not only the map but also involved additional data analyses and the development of various maps, all of which are documented in detail within my notebooks.
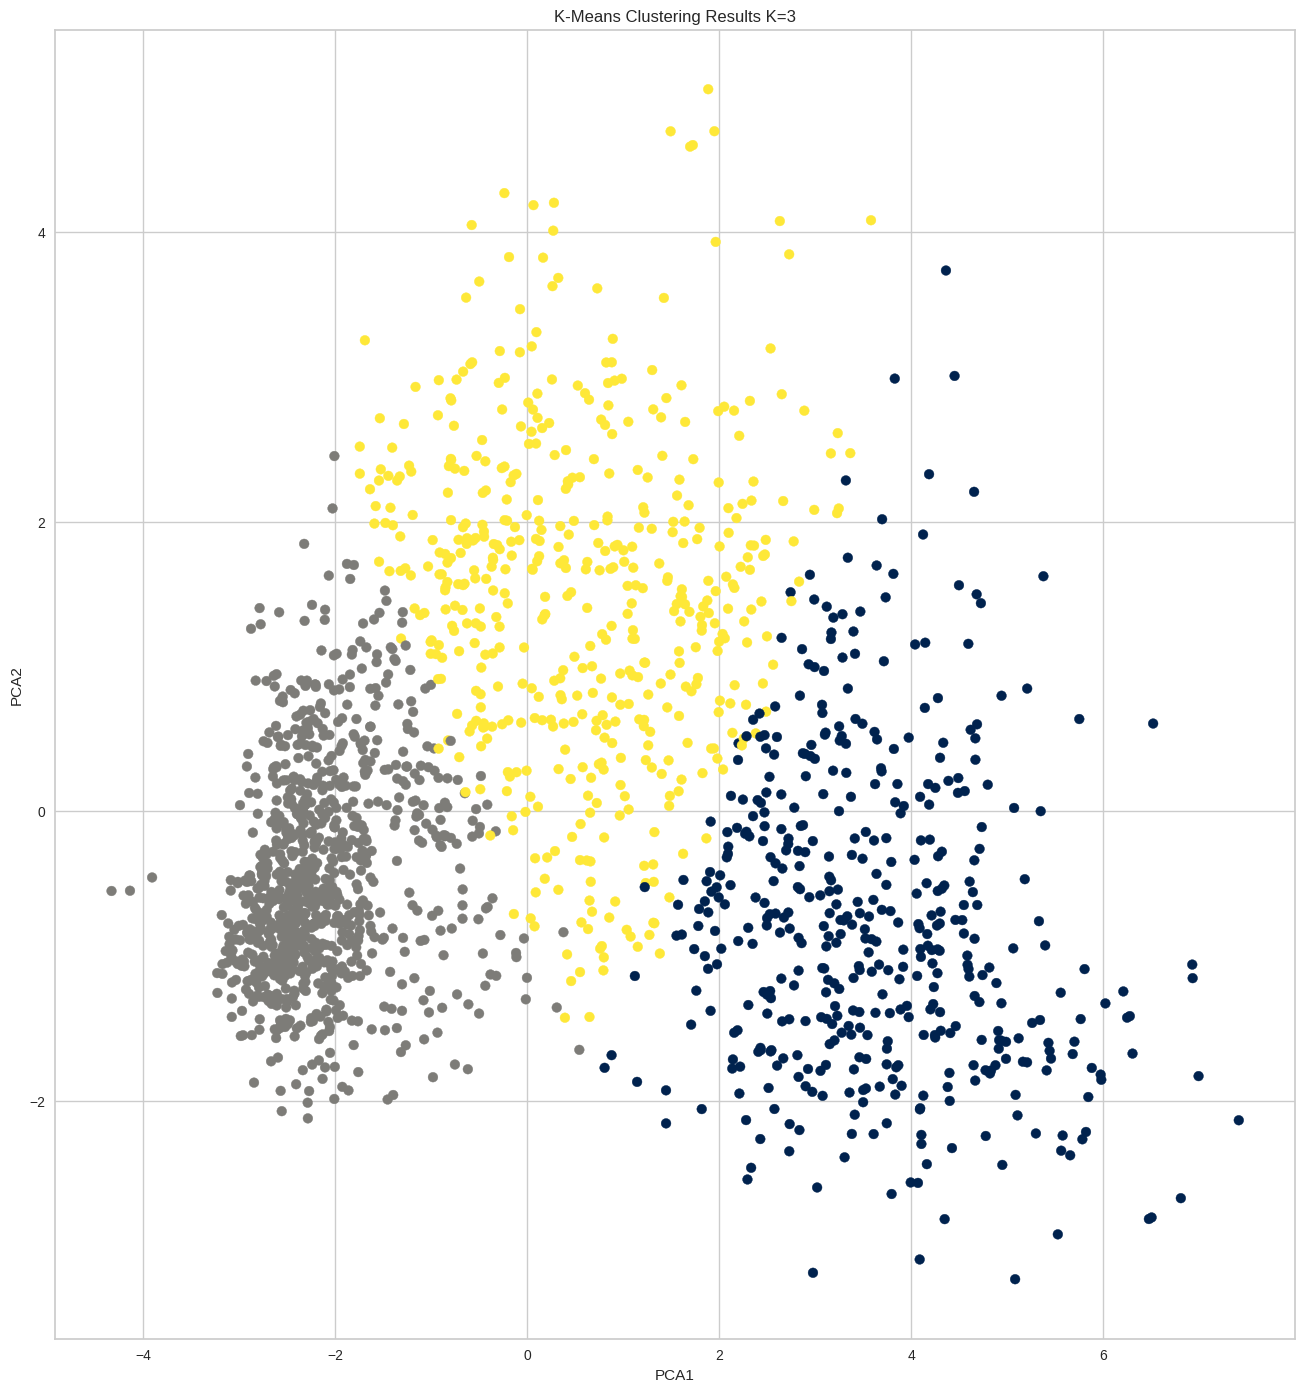
Clustering with Customer Personality Analysis dataset and K-menas.
In this analysis, I employed the K-means model for Customer Personality Analysis Data, following a systematic workflow. I began with data summary to establish a foundational understanding of the dataset. Subsequently, I delved into data visualization and missing value imputation, ensuring data integrity. The detection and management of outliers further refined the dataset. I applied data transformation techniques, including Ordinal and One-Hot encoding , followed by data scaling for consistency. Dimensionality reduction using PCA enhanced efficiency. The pivotal step of finding the best K for the K-means model was executed, culminating in the clustering summary.
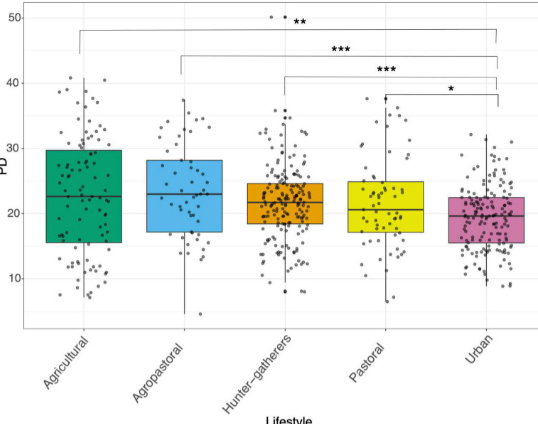
Human Gut Microbiome Across Different Lifestyles: From Hunter-Gatherers to Urban Populations.
The main goal of this work was the collection and comparison of 16S data from the gut microbiome of populations that have different lifestyles around the world. With the data obtained from 14 studies, it was possible to compare the gut microbiome of 568 individuals that represent populations of hunter-gatherers, agricultural, agropastoral, pastoral, and urban populations.
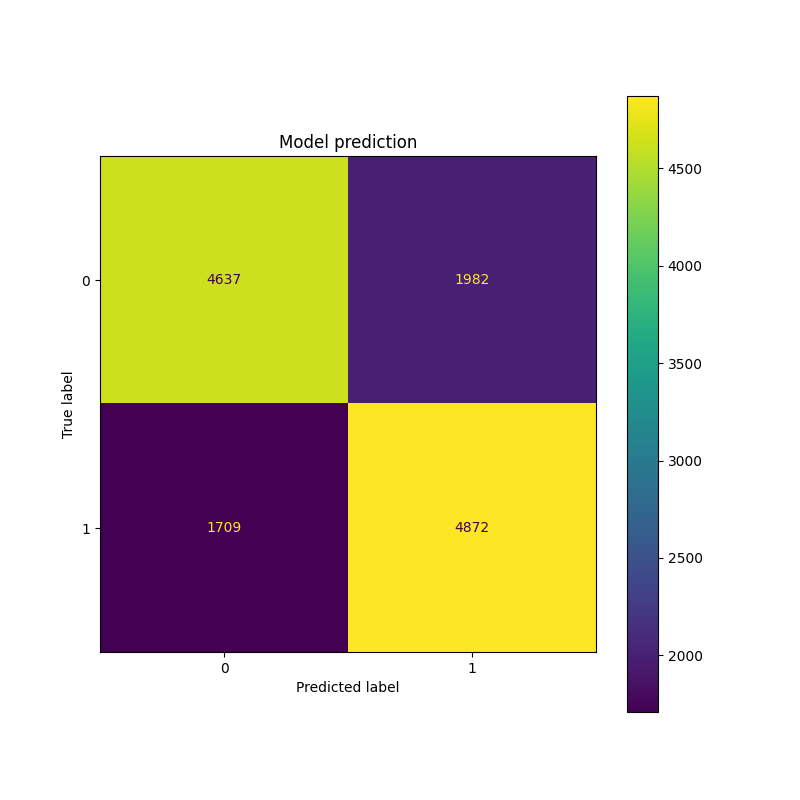
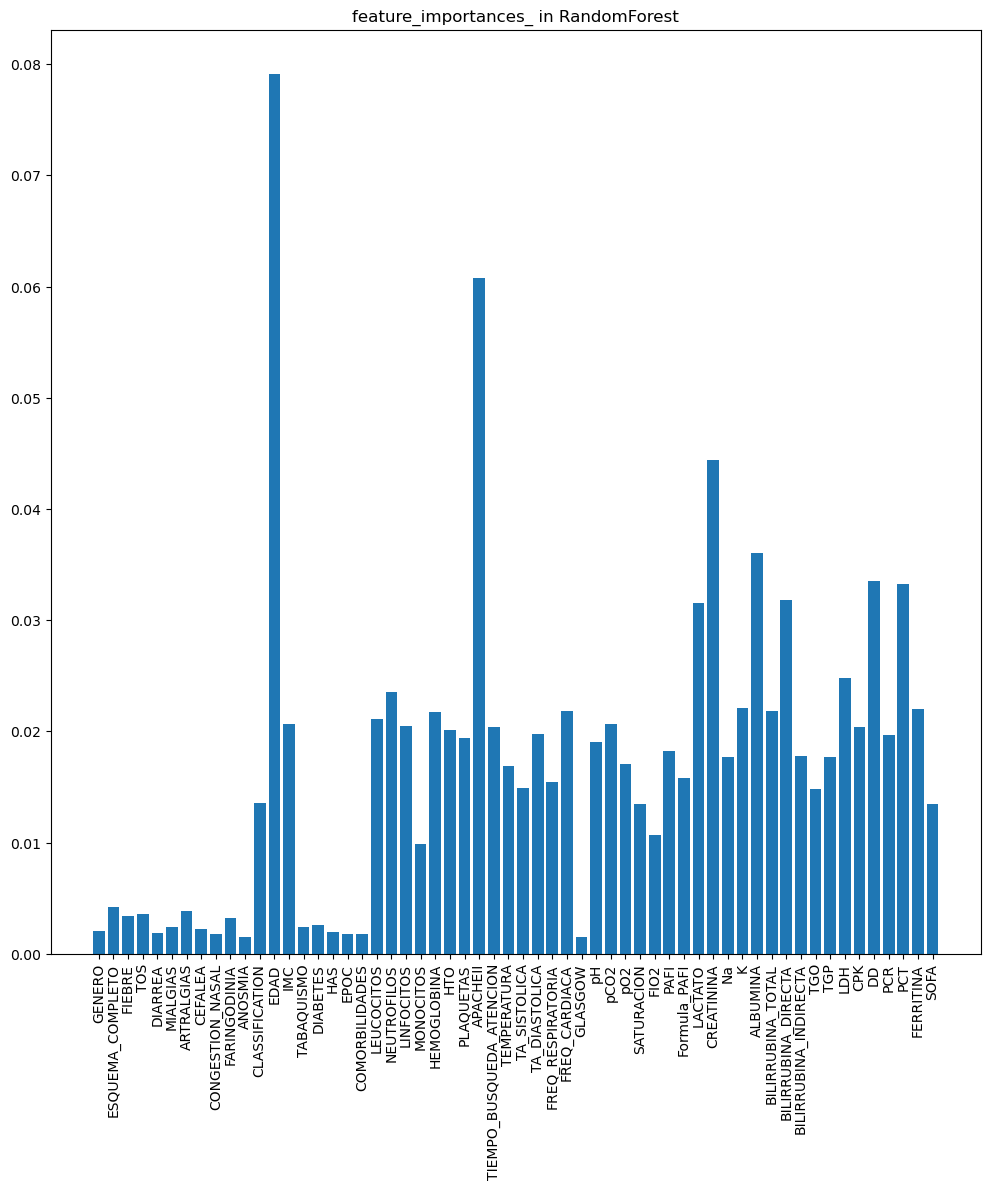
COVID-19 Outcome Prediction with RandomForest, LGBM and Nearest Centroid models.
In this in-depth analysis using COVID-19 data, I took on the crucial task of managing missing data by employing the Iterative Imputer method. I also conducted feature selection to streamline the prediction process. Then, I ventured into COVID outcome prediction using a diverse array of models, including the robust RandomForest , the agile LGBM , and the specialized Nearest Centroid . This meticulous and comprehensive approach didn't merely yield results; it provided us with a wealth of insights and predictive outcomes that shed light on the complex landscape of COVID-19 data.